Follow your data
Draw how data moves through stages, from where it is produced to where it is stored, and export it to Mermaid.
What you'll get
- A data flow with stages
- Several flows per diagram
- A Mermaid export
Open the Data Flow tab
Click Data Flow in the tab bar. The left panel lists the diagram’s flows, with the number of stages in each. Click one to open it, or click Create flow to start another. A diagram can hold as many flows as you need.
Once a flow is open, its name sits at the top of the left panel (1). Click the name to rename it. All flows takes you back to the list.
Add stages
A flow has three columns: sources, where the data comes from, transforms, where it changes, and sinks, where it ends up. Each stage is a card (2) with its tool and a short description.
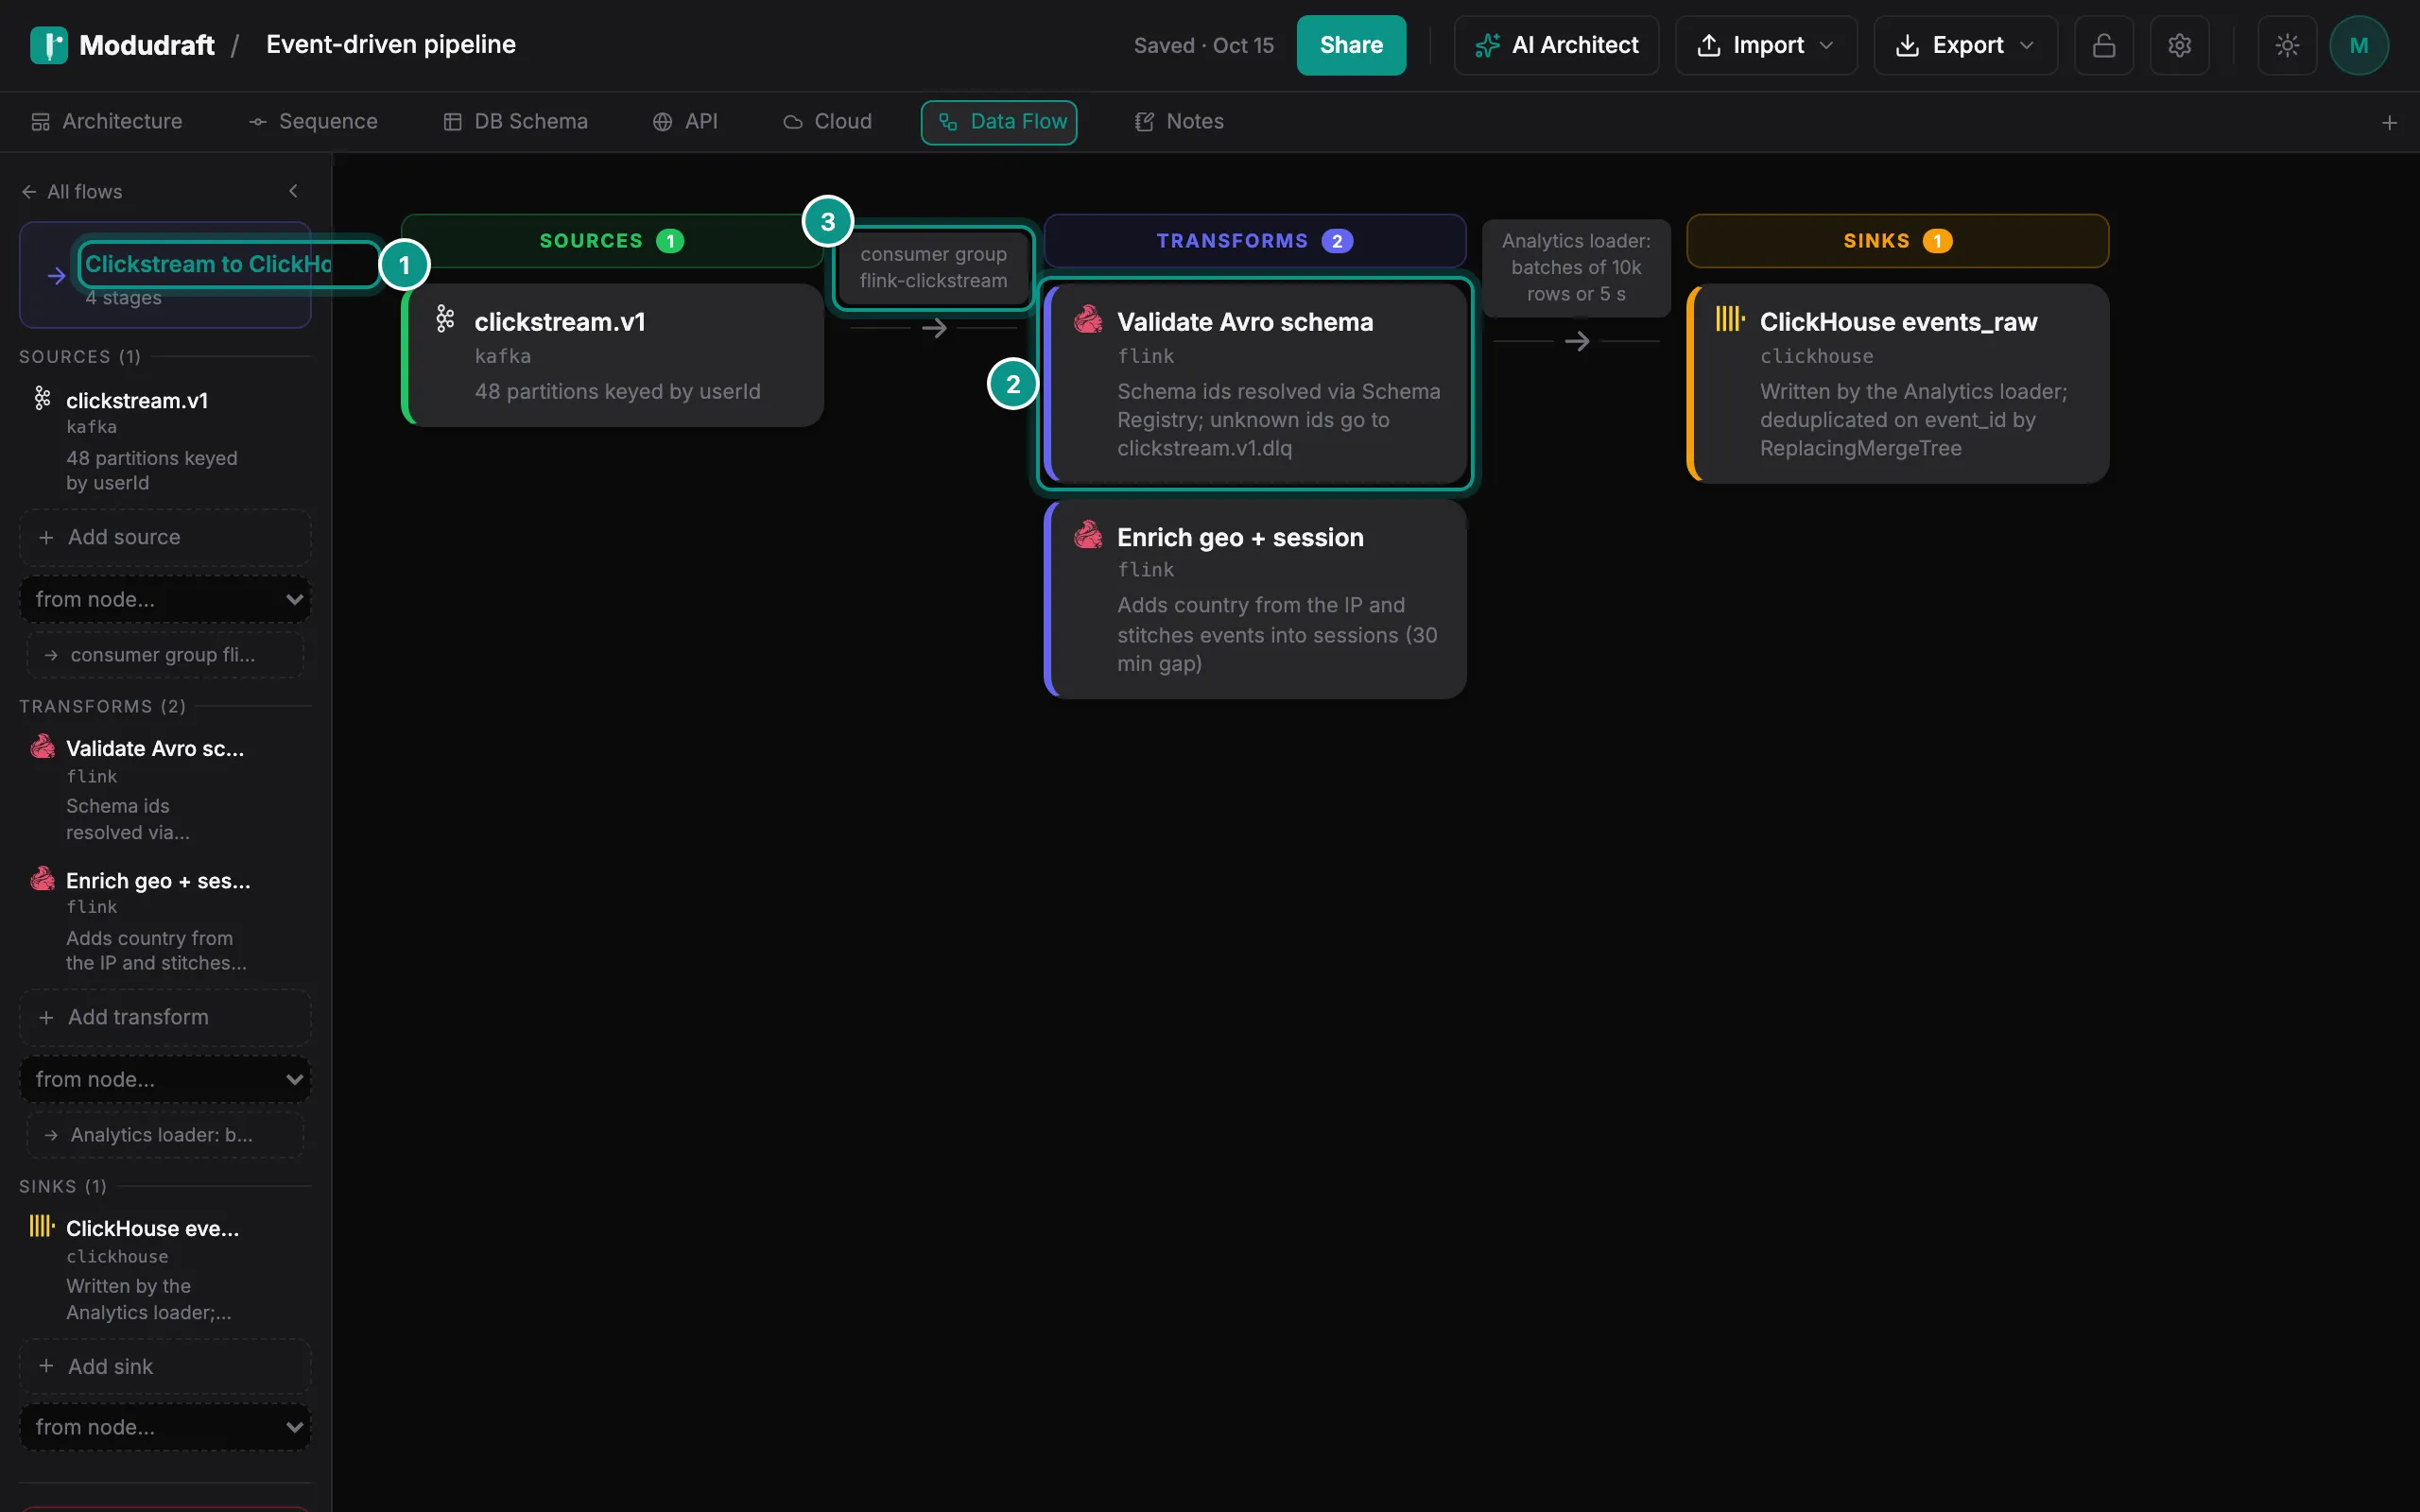
In the left panel, each column has its own add button: Add source, Add transform and Add sink. Or pick a component in from node below it: the new stage takes the component’s name and links to it.
Between the columns you can note how the data moves, such as the consumer group that reads a topic (3). Type it in the left panel, in the Add a note on this connection field under the sources or the transforms.
Edit a stage
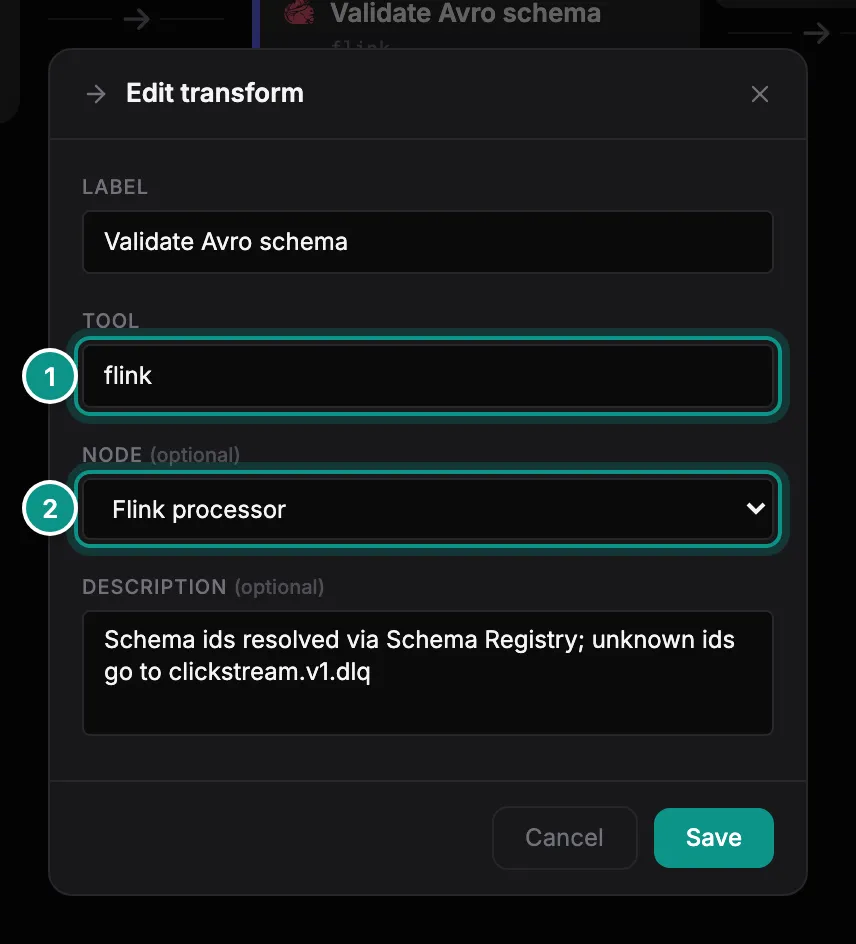
To edit a stage, point at it in the left panel and click its pencil. You can change its label, its tool (1) and its description. Under Node (2), link it to a component from your Architecture tab, or leave it empty.
Click a stage to see where it is used in the other views.
Export it
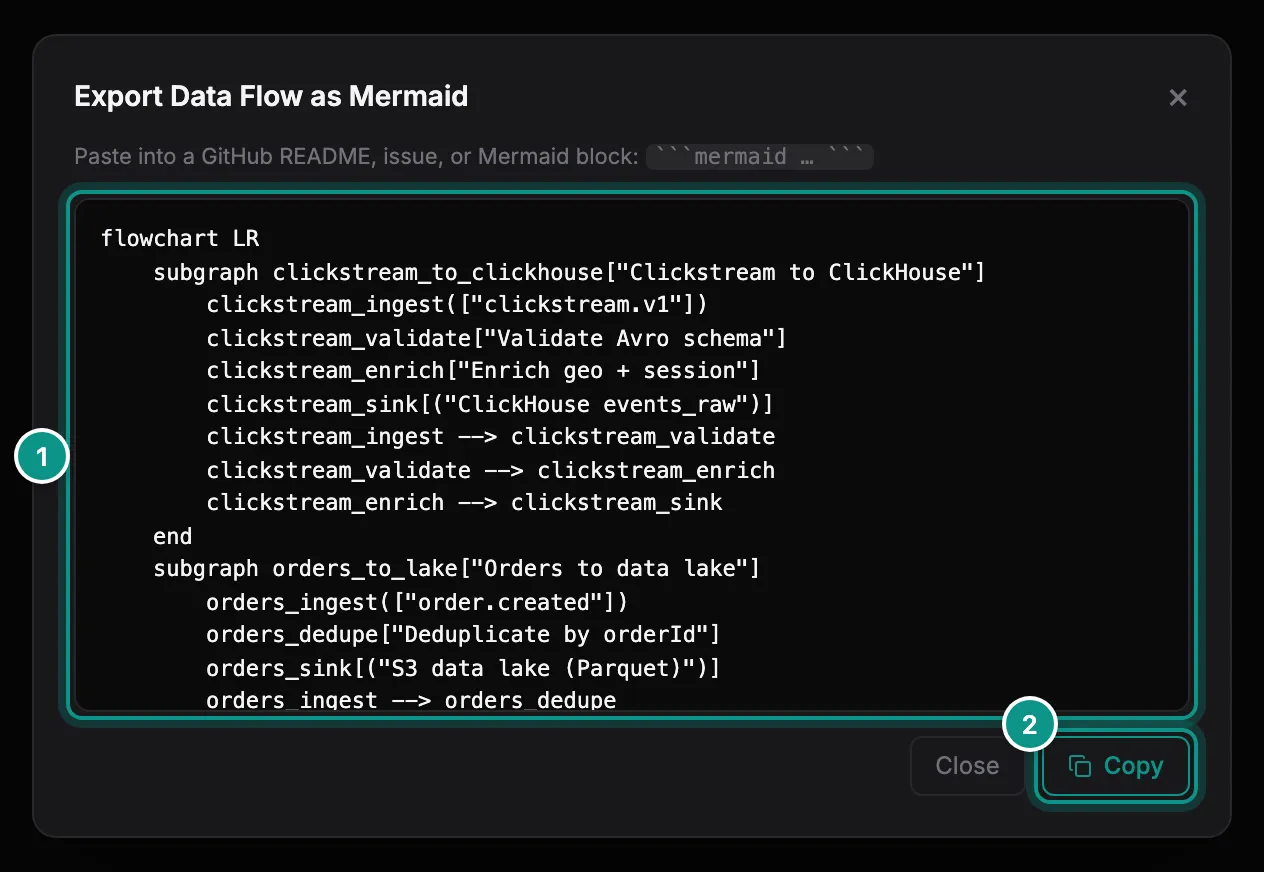
Open Export in the toolbar and, under This tab, choose Mermaid…. Every flow in the diagram becomes a Mermaid flowchart (1), one block per flow. Copy (2) puts it on your clipboard, ready for a README or an issue.
Next, draw the network your system runs on in the Network guide.